MDM Automation Benchmark: How to Measure Automation Performance
Deploying mobile device management (MDM) automation and measuring whether it's working are two different projects. Most teams only ever do the first one. They can tell you how many workflows are running, how many alerts got auto-closed this month, how big the automated-response library has grown. None of that answers a much simpler question: are devices actually failing less often than they were before any of this existed?
Answering that question takes a benchmark. A benchmark is meant to close the gap between "automation is running" and "automation is working." It doesn't do that with a single score borrowed from an industry report, but by answering four specific questions: How much is actually being handled? Is any of it solving the problem? How much faster are things moving? Can the automation itself be trusted to run?
This article walks through all four, how to calculate each one, and where the data your MDM platform already collects can and can't get you there.
- 1 : What Does MDM Automation Benchmark Measure?
- 2 : Measure Automation Coverage: How Much Work Is Handled Automatically?
- 3 : Measure Automation Effectiveness: Does Automation Actually Solve Problems?
- 4 : Measure Operational Efficiency: Is Automation Reducing Management Effort?
- 5 : Measure Workflow Reliability: Can the Automation Itself Be Trusted?
- 6 : Compare Performance Through Baselines, Device Groups, and Maturity Stages
- 7 : How AirDroid Business Supports Automation Measurement
- 8 : MDM Automation Benchmark Checklist
What Does MDM Automation Benchmark Actually Measure?
A useful benchmark for mobile device management (MDM) automation covers four things, and they're not interchangeable. A team can be strong on one and weak on another without anyone noticing, because most dashboards only show the one they've already set up to track.
Dimension | Key question | Example metrics |
|---|---|---|
| Automation Coverage | How much work is actually automated? | Automation Handling Rate, Manual Escalation Rate |
| Resolution Effectiveness | Does automation solve the problem, or just respond to it? | First-Time Resolution Rate, Repeat Incident Rate |
| Operational Efficiency | Is automation making response faster and cleaner? | Mean Time to Resolution (MTTR), Alert Noise Rate |
| Workflow Reliability | Can the automation itself be trusted to run? | Workflow Failure Rate |
Coverage and reliability get measured the most, mostly because they're the easiest numbers to pull. Effectiveness gets measured the least, which is a problem, because it's the one that actually answers "is this working."
Measure Automation Coverage: How Much Work Is Handled Automatically?
Coverage answers a narrower question than people think it does: not "how much automation have we built," but "how much of what actually happens gets picked up by it."
Automation Handling Rate
Automation Handling Rate is the share of qualifying events, an alert, a status change, a threshold breach, that get resolved by a workflow without a person touching them.
Escalation Rate
Escalation Rate is the mirror image: the share that still need a human.
Say a fleet logs 1,000 qualifying alerts in a month, and 640 get closed out by an automated workflow. That's a 64% handling rate and a 36% escalation rate. Add them together and you get 100%, because they're really one number described from two directions, not two separate metrics that happen to be related.
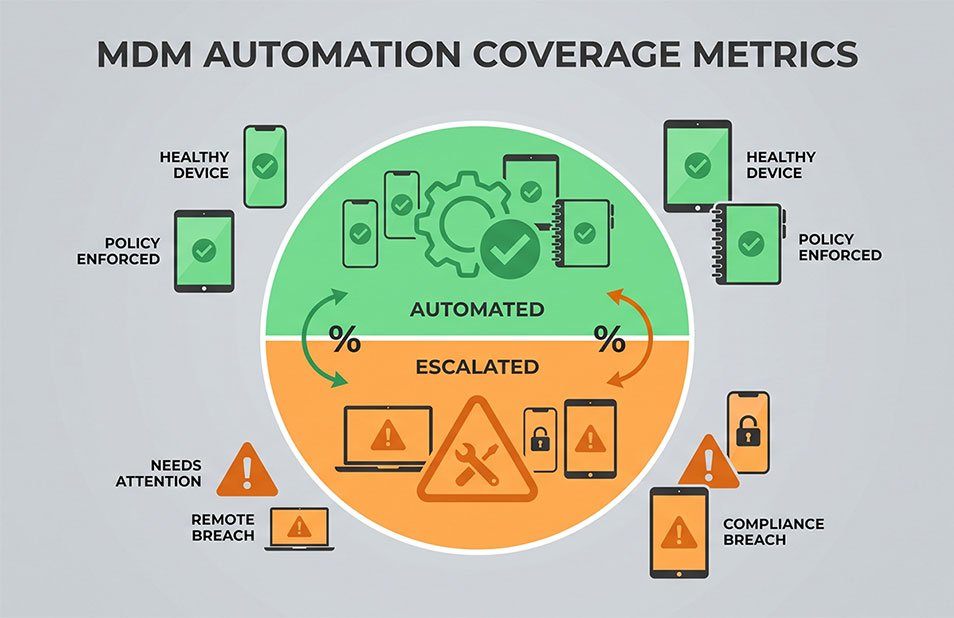
Here's the part worth saying plainly: a high escalation rate isn't automatically a failure. Some things shouldn't be automated. A device that needs a factory reset because of a suspected security issue, or an alert that requires someone to physically check a kiosk, belongs with a person. If your escalation rate for those categories is high, the automation is doing its job by staying out of the way.
Where coverage does matter is inside the categories you've already decided are safe to automate. If battery alerts, storage warnings, or offline notifications are still routing to a person half the time even though a workflow exists for them, that's worth looking at, not because automation should handle everything, but because it's not handling what it was built to handle. Whether those alerts are firing early enough to act on in the first place is a separate question, covered in Predictive Device Monitoring for MDM.
Measure Automation Effectiveness: Does Automation Actually Solve Problems?
This is the one most benchmarks skip, and it's the one that matters most.
A workflow can run successfully, notification sent, ticket logged, device rebooted, and the underlying problem can still be sitting there untouched. A workflow "succeeding" means it executed without errors. It says nothing about whether the device is actually fixed.
First-Time Resolution Rate tracks how often an issue is actually closed after the first automated response, without recurring.
Repeat Incident Rate tracks the opposite: how often the same device throws the same alert again within some window after a workflow already ran on it.
What happened | Workflow status | Problem actually fixed? |
|---|---|---|
| Alert fires, notification sent to IT | Success | Unknown, no one checked |
| Alert fires, device rebooted automatically | Success | Maybe, only if reboot was the actual fix |
| Alert fires, same alert fires again in 3 days | Success (twice) | No, this is a repeat incident |
None of this gets tracked automatically today in most MDM platforms. There's no field anywhere that says "resolved: yes/no." What it takes instead is a manual pass through the audit logs: pulling up the same device and the same alert type, and checking whether it shows up again in the days after a workflow ran. Tedious, but it's the only way to tell the difference between "the notification went out" and "the problem went away."
Measure Operational Efficiency: Is Automation Reducing Management Effort?
Efficiency is where automation is supposed to pay off in hours, not just in outcomes.
Mean Time to Resolution (MTTR)
MTTR is the average time between an issue surfacing and it being closed out, whether that closing happens automatically or with a person in the loop. If MTTR for battery alerts was running 8 hours before a workflow existed and dropped to under an hour after, that's the number that justifies the automation investment, not the count of workflows deployed.
Alert Noise Rate
Alert Noise Rate measures something different: how much of what's coming in is actually worth anyone's attention. Imagine a team receiving 300 alerts a week, and 210 of them are the same low-priority storage warning firing repeatedly on a handful of devices that everyone already knows about. A high noise rate doesn't just waste time, it trains people to skim past alerts, including the ones that matter. This is the same thing people mean when they talk about alert fatigue. More alerts isn't more visibility. It's often less.
Measure Workflow Reliability: Can the Automation Itself Be Trusted?
Coverage, effectiveness, and efficiency all assume the automation ran in the first place. Sometimes it doesn't.
Workflow Failure Rate tracks how often a workflow itself fails to complete. A few ways that shows up:
- An API call times out
- A data field comes back empty
- A step partially executes and leaves things in a half-finished state
This is a different failure mode from "the workflow ran but didn't fix anything." Here the workflow never actually did what it was supposed to.
A team that never checks this number tends to find out the hard way, usually when someone notices a device has been sitting in a broken state for a week because the workflow that was supposed to catch it quietly stopped firing three weeks earlier.
Compare Performance Through Baselines, Device Groups, and Maturity Stages
There's no external number that tells you whether a 64% handling rate is good. It depends on your fleet, your device mix, and what you were doing before. Three comparisons actually mean something:
- Against your own history. Track these numbers monthly and compare this quarter to last quarter. A handling rate that's climbing, or an MTTR that's shrinking, tells you the automation is maturing. A benchmark you hit once and never check again isn't a benchmark, it's a snapshot.
- Across device groups. A retail kiosk fleet and a logistics handheld fleet will show different numbers for almost everything here, and that's expected, not a red flag. Comparing kiosk performance to kiosk performance, and handheld to handheld, tells you more than a single blended average ever will.
- Against a maturity model. This one's less about a specific number and more about what kind of automation you're actually running.
Level | What it looks like |
|---|---|
| 1. Manual | Alerts are reviewed and acted on by a person, no automated response |
| 2. Assisted | Alerts trigger a notification, but a person still decides and executes the action |
| 3. Workflow-driven | Defined workflows execute standard actions automatically for known alert types |
| 4. Governed | Automated workflows run with built-in checkpoints for human approval on higher-risk actions |
| 5. Optimized | Automation is continuously measured and adjusted based on the metrics above, not left running untouched |
Most teams running MDM automation today sit somewhere around Level 2 to 3, and that's the range most current tools are built to support well. Level 5 in particular assumes a level of continuous measurement that very few organizations, in any category of IT, actually do.
How AirDroid Business Supports Automation Measurement
AirDroid Business doesn't generate these scores for you. What it provides is the raw material teams need to calculate them.
Device monitoring and configurable alerts cover the conditions most of these metrics are built on, among others:
- Battery Capacity and Battery Temperature
- Insufficient Storage
- App Running Status and Foreground App Status
- Device Cellular Data Usage
Each alert-triggered workflow also leaves behind an audit log. The specific fields vary by workflow, but typically include the device name, model, the triggering value, and a timestamp. That's exactly the raw data a First-Time Resolution Rate or Repeat Incident Rate calculation starts from.
For the "Governed" level in the maturity table above, this isn't hypothetical. Workflows can include a Pause & Resume step paired with an Interactive Form, so a higher-risk action, a factory reset, say, stops and waits for a person to confirm before it executes. That's a specific, real mechanism, not a general claim about "human oversight."
What AirDroid Business doesn't do is calculate any of the four dimensions automatically or hand you a benchmark score. The alerts, the logs, and the workflow history are there. Turning them into a Handling Rate or an MTTR trendline is still a job for whoever owns this on your team, usually by exporting the logs and doing the math outside the platform.
Turn Workflow Logs into a Real Automation Benchmark
Alert history, workflow execution logs, and device status are already there. AirDroid Business gives IT teams the raw data to measure coverage, resolution, and reliability, so automation performance stops being a guess.
MDM Automation Benchmark Checklist
- Do we know how many alerts are handled automatically, versus escalated to a person?
- Do we track whether automated responses actually stop the issue from recurring, not just whether the workflow ran?
- Do we monitor how often workflows themselves fail to execute?
- Do we compare performance against our own historical baseline, not an industry number we can't verify?
- Do we know which maturity level our automation is actually operating at, versus which one we assume it's at?
If most of these are unanswered, that's not a sign the automation isn't worth having. It's a sign nobody's checked yet whether it's earning its keep. That's a different problem, and a much easier one to fix.
Final Words
Go back to that fleet manager pulling up the dashboard. 40 workflows, 1,200 alerts closed, an empty ticket queue, none of that was wrong information. It just wasn't the right question. The right question is whether devices are failing less than they used to, and that only shows up once someone tracks coverage, effectiveness, efficiency, and reliability on purpose, on a schedule, against a baseline that's actually theirs.
None of the four metrics above require new tools to start tracking. They require someone to start pulling the alert history and workflow logs that already exist and asking what they add up to. That's a smaller lift than it sounds, and it's the difference between an automation setup that looks busy and one you can actually stand behind.










Leave a Reply.